
Debugging
Here's a little bit of history required to understand the available options for debugging D programs with Visual Studio.
If you are only interested in the latest state with VS 2015 or later, you can skip all this and go directly to the recommendation.
VS 2008-2010 cv2pdb
Development of Visual D started around 2009, with VS 2008 being the latest Visual Studio version. DMD only supported Windows 32-bit programs, with debug information written in an ancient version of CodeView. This was not well understood by the Visual Studio debugger, basic operations like setting breakpoints and investigating struct members didn't work. That's why cv2pdb was created to convert the old CodeView debug information embedded into the executable to a newer version of CodeView written into a PDB file.
VS 2008 and VS 2010 have two engines for debugging native code, one mainly targeted at C/C++ and one for mixed native and managed code. Both understood visualizer descriptions in a file named autoexp.dat, that cv2pdb took advantage of to display some D constructs in watch windows: slices, strings and associatives arrays. That made debugging D programs quite possible, though debug info from the compiler was very basic. Some quirks had to be accepted, e.g. type names must not contain '.' to avoid confusing the debugger, so it is replaced with '@'. Expressions need to be specified in C/C++ syntax.
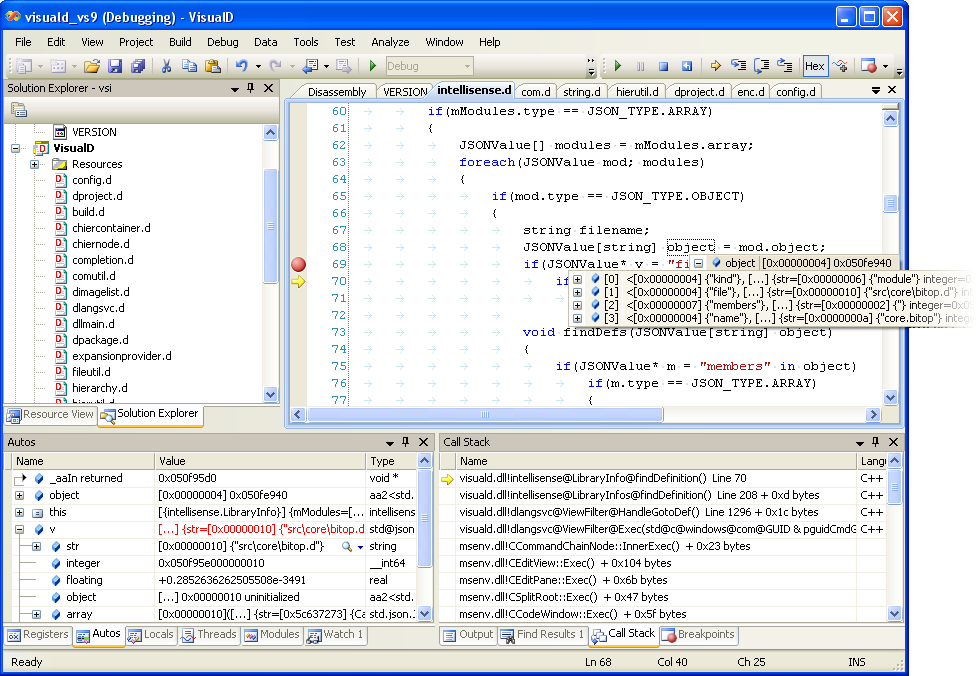
Here is an example debugging session that used cv2pdb
mago
In 2010, Aldo Nunez surprised the D community with a new debug engine dedicated to the D language, that plugs in to Visual Studio as an extension. This engine can read the old CodeView debug information emitted by DMD. Having full support for D types and expressions, the above quirks are avoided. In addition, there is no need to supply slow visualizer macros as mago can display slices, strings and more nicely. You can select the mago debug engine in the project debugging settings of a Visual D project.
One downside of the mago debug engine is that it does not support all the features of the native Visual Studio debugger, e.g. conditional breakpoints, hardware assisted breakpoints or attaching to a process.
64-bit
DMD added 64-bit Windows support in 2012, writing COFF object files supporting the newer version of the CodeView debug information from the start. So there is no need to use a conversion tool for its output. In 2014, DMD got the option to also emit COFF files for 32-bit code using the same debug format.
The visual studio debuggers obviously had 64-bit support, and mago followed suite in 2014 including support for the PDB debug info format.
VS 2012-2013 New debug engine
Starting with Visual Studio 2012, Microsoft introduced a new debugger that replaced the native debug engine. Unfortunately, it had some incompatibilites with the preceding debug engine. This includes displaying D variables in the Watch Window and interpretation of the visualizer macros in autoexp.dat. The new engine has extended visualizer capabilities, but these are targeted to C/C++ and don't work well with D syntax.
You can switch back to the old debug engine by going to Tools->Options and then under the debugger settings, turn on native edit and continue. This is a global setting and will also affect your C++ projects, though.
Mago is uneffected by this change. The VS 2013 debugger engine fixed some of the problems with displaying local variables.
VS 2015 Concord extensions
With the next version of the debug engine supporting "native edit and continue", the fallback to the old debug engine no longer works in VS 2015. Instead Microsoft released information about the extensibility of this debug engine (introduced with VS2012) called Concord, late in 2015. It consists of more modular components than older engines. This allows taking advantage of most features of the debug engine by just replacing language specific parts, i.e. the expression evaluator. In addition, debugging mixed languages is no problem anymore.
Using Mago's expression evaluator allowed to implement this for D pretty easily:
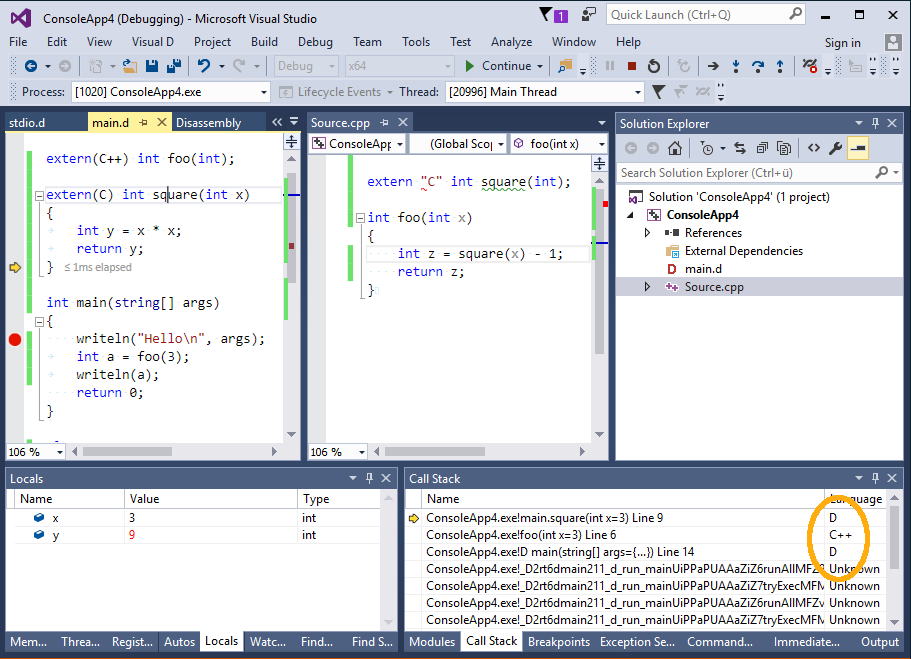
The debugger engine needs to detect the source language of the code location. This information is added to the debug information starting with dmd 2.072 when compiled for COFF object files (-m64 or -m32mscoff) with -g, but not with -gc, i.e. you should select debug info for Mago even when using the VS debug engine.
Recommendation for VS 2015 or later
- use DMD 2.072 or later
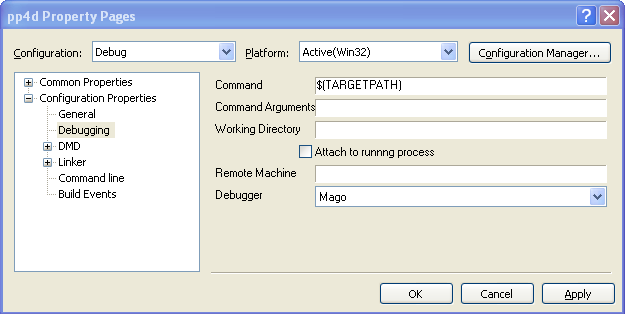
- for Visual D projects, compile to COFF even for Win32 by enabling "Use MS-COFF object file format" on the project configuration page Compiler->Output
- choose the Visual Studio debugger on the project configuration page Debugging
If you are using the new Visual C/C++ project integration, all you have to do is enable debug information on the project configuration page "D Compiler->Code generation".
Exceptions
As of version 0.3.21, the installer adds an entry "D Exception" to the list of Win32 exceptions that can be found in the Debug->Exceptions dialog. This allows the debugger to stop execution when an exception is thrown by the debuggee. With earlier versions, you'll have to add an entry with code 0xE0440001 yourself.
Exceptions with Mago
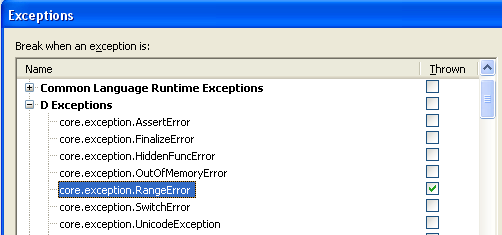
The Mago debug engine displays exceptions thrown by the debuggee in the output window. You can also stop execution by enabling the respective box in the Debug->Exception dialog. Due to a bug, you currently cannot simply enable the "D Exceptions" entry, but must select the specific exceptions while keeping the "D Exceptions" entry unchecked. So, the dialog should look something like this:
Debugger Customization
Starting with Visual D 1.0 the display of structs and classes can be customized in the mago expression evaluator for the Concord debugger engine (when using dmd as the compiler). This is done by enabling "Call struct/class methods __debug[Overview|Expanded|StringView]" in the global mago Debugging options for mago and adding some extra methods or fields to the declaration of the struct or class:
- __debugOverview will be evaluated to display the single line representation in the watch, locals or auto window.
- __debugExpanded will be evaluated to display the expanded list of members in the watch, locals or auto window.
- __debugStringView will be evaluated to populate the text visualizer window.
The type of the return value determines what fields are displayed. Here is an example session:
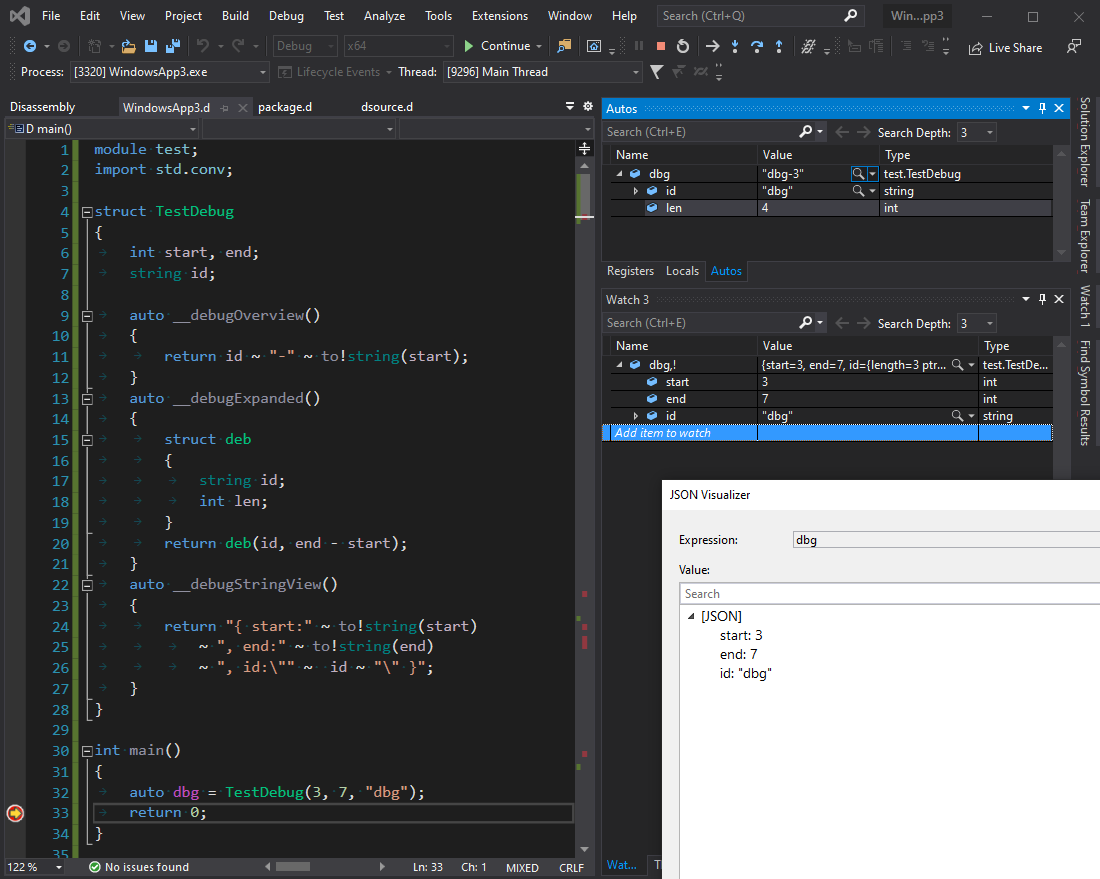
Instead of functions you can also define the __debug* properties as fields that are eagerly filled by the regular code. You must not alias other members because that information is not available in the debug information.
The JSON Visualizer window was opened by clicking the focused lense in the Autos window. As with other special display functionality, the function evaluation can be disabled by appending ",!" to the expression as shown in the watch window.
While executing these functions for display, the GC is switched to a region allocator that discards all memory when excution of the debuggee is resumed (this can be disabled in the global debugger options with setting "Switch GC while executing debugger functions"). So you should not keep references to memory allocated during execution of the __debug* functions.
Displaying Ranges
Enabling mago debugger option "Call range methods to show elements in overview/expansion" activates function evaluation of methods save, empty, front and popFront if they all exist. This allows displaying forward ranges as a list of their elements.
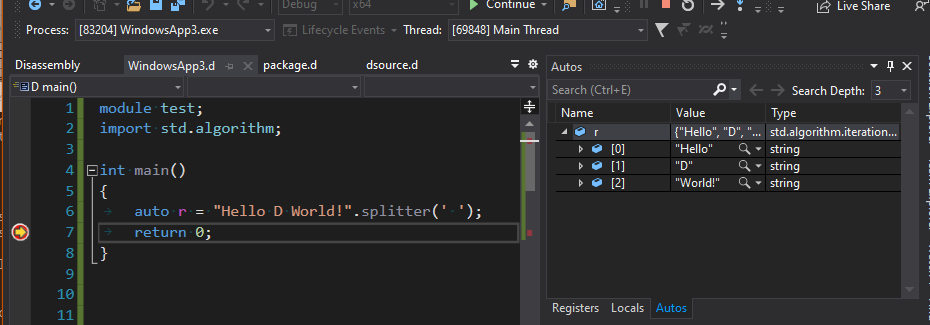
This is currently considered experimental, because it is rather slow.
Known issue: if front returns a reference to the element, the wrong value is displayed. This is caused by bad debug information.