
Profiling
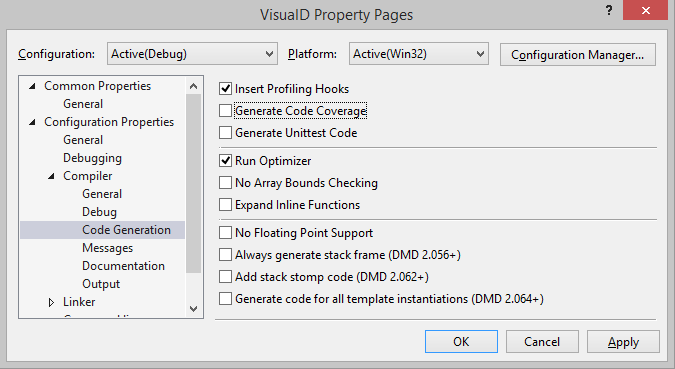
DMD comes with an option to instrument an executable for profiling its execution. You can enable it on the project configuration page "Code Generation".
Running the executable will create a file named trace.log in the current working directory. Opening the profiler window from the Visual D menu allows browsing the info in this file conveniently. You must specify the full path to the trace.log in the edit field at the top of the window.
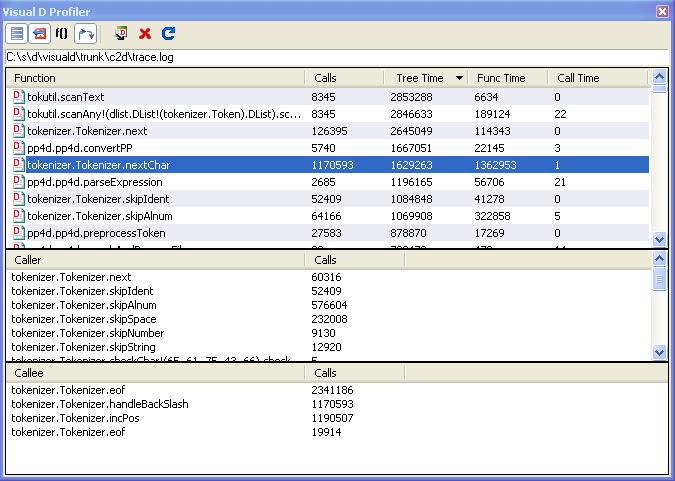
The toolbar at the top is used to
- enable/disable alternate color display for the rows
- enable/disable automatic closing of the profiler window if you jump to a function by double-clicking its list entry
- enable/disable display of full type information of the functions
- enable/disable display of function fan in/out, i.e. which functions are called by the selected function and which functions are calling it
- guess the location of the trace.log file from the current startup project and its debugging settings
- remove the trace.log file from disk to start a new profiling session (without removing the file multiple runs of the executable accumulate statistics in the log file)
- refresh display from the trace.log file
The times in the function list are displayed in microseconds.
- Tree time: time spent executing the function including functions called
- Func time: time spent executing the function excluding functions called
- Call time: Func time/Calls
Double-clicking a line in the function list tries to jump to the corresponding source code line. This relies on appropriate information found in generated JSON files.
Double clicking a line in the caller/callee lists selects the function in the function list, so you can navigate through the call tree.